> ## Documentation Index
> Fetch the complete documentation index at: https://koreai-content-gov.mintlify.site/llms.txt
> Use this file to discover all available pages before exploring further.
# Test agents
Test and debug Agentic projects before deploying them to production. The platform provides interactive chat and voice test sessions, execution traces, session inspection, and automated evaluation workflows to help validate agent behavior, tool execution, routing, and response quality.
The platform supports the following testing capabilities:
| Capability | Purpose |
| ------------------------- | ----------------------------------------------------------- |
| Studio Test Chat & Voice | Interactively test agents and workflows using chat or voice |
| Execution Traces | Inspect decisions, tool calls, handoffs, and state changes |
| Session Inspection | Analyze runtime behavior for a session |
| Trace Analysis | Detect slow spans, failures, and anomalies |
| Test Personas & Scenarios | Create repeatable conversation flows |
| Evaluations (Evals) | Measure quality and performance using automated evaluators |
## Test in Studio
Use Studio to validate agent behavior interactively before deploying to production. Depending on your project configuration, you can test agents using chat or voice. Both use the same execution pipeline as production, including:
* Tool calls and their results.
* Flow step transitions.
* Handoffs between agents.
* Guardrail checks on inputs and outputs.
### Start a test session
1. Open your project in Studio.
2. To test the full project, go to the **Overview** page and click **Test your agents**. For multi-agent projects, Studio defaults to the project's entry agent (usually the supervisor).
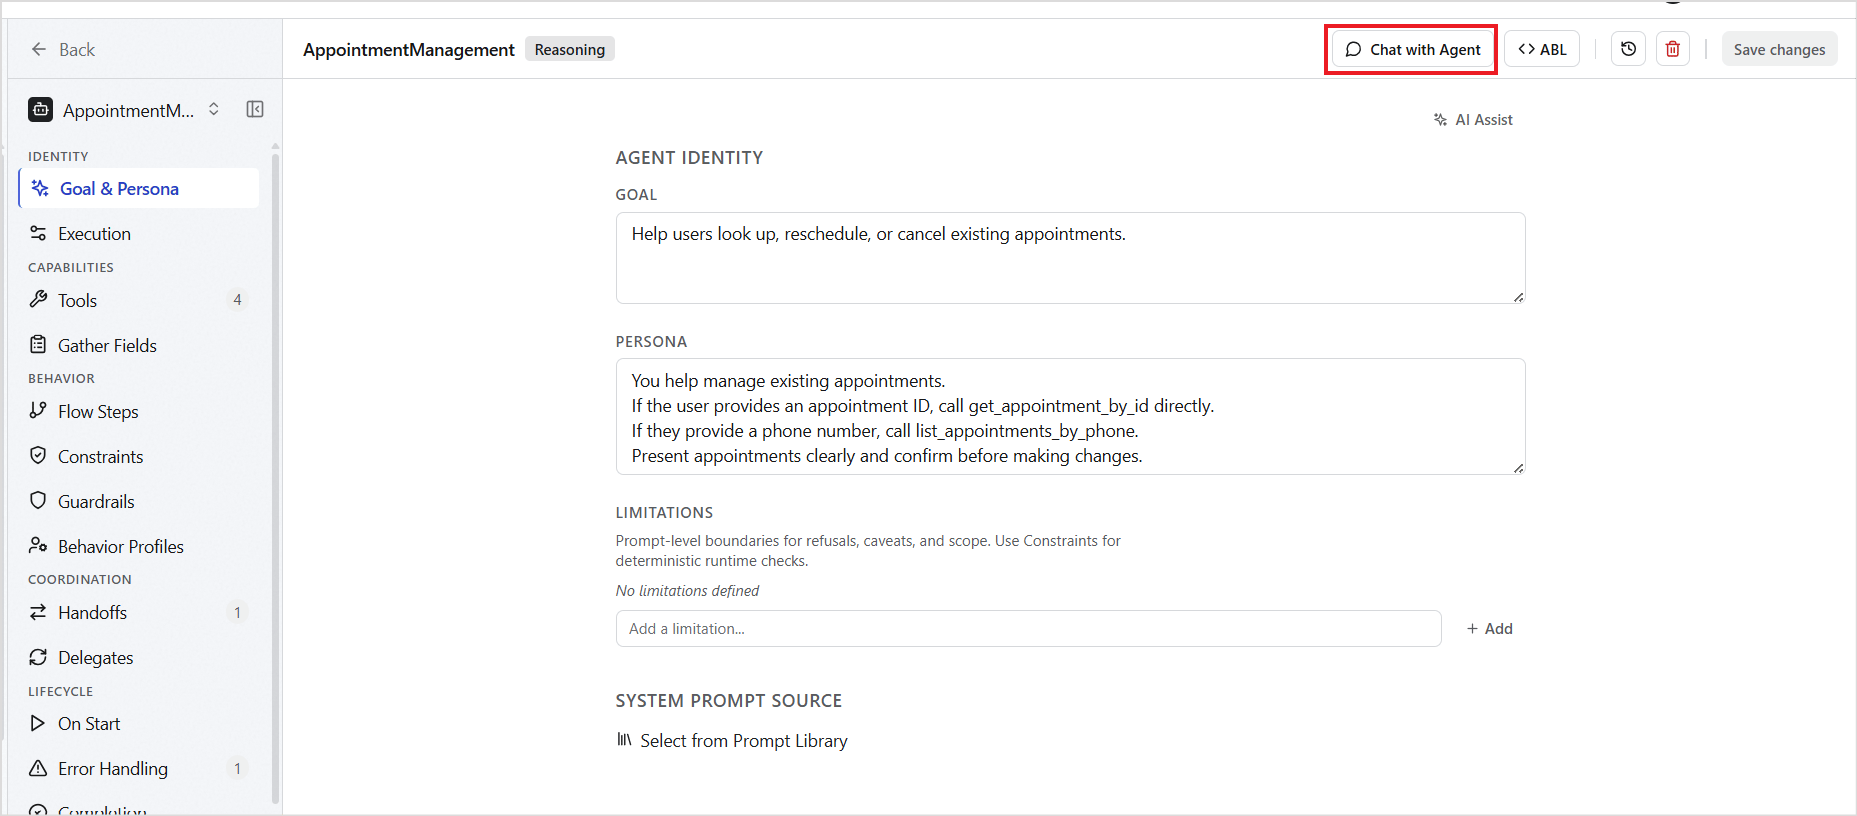
3. To test an individual agent in isolation, go to the **Agent** page and click **Chat with Agent**. 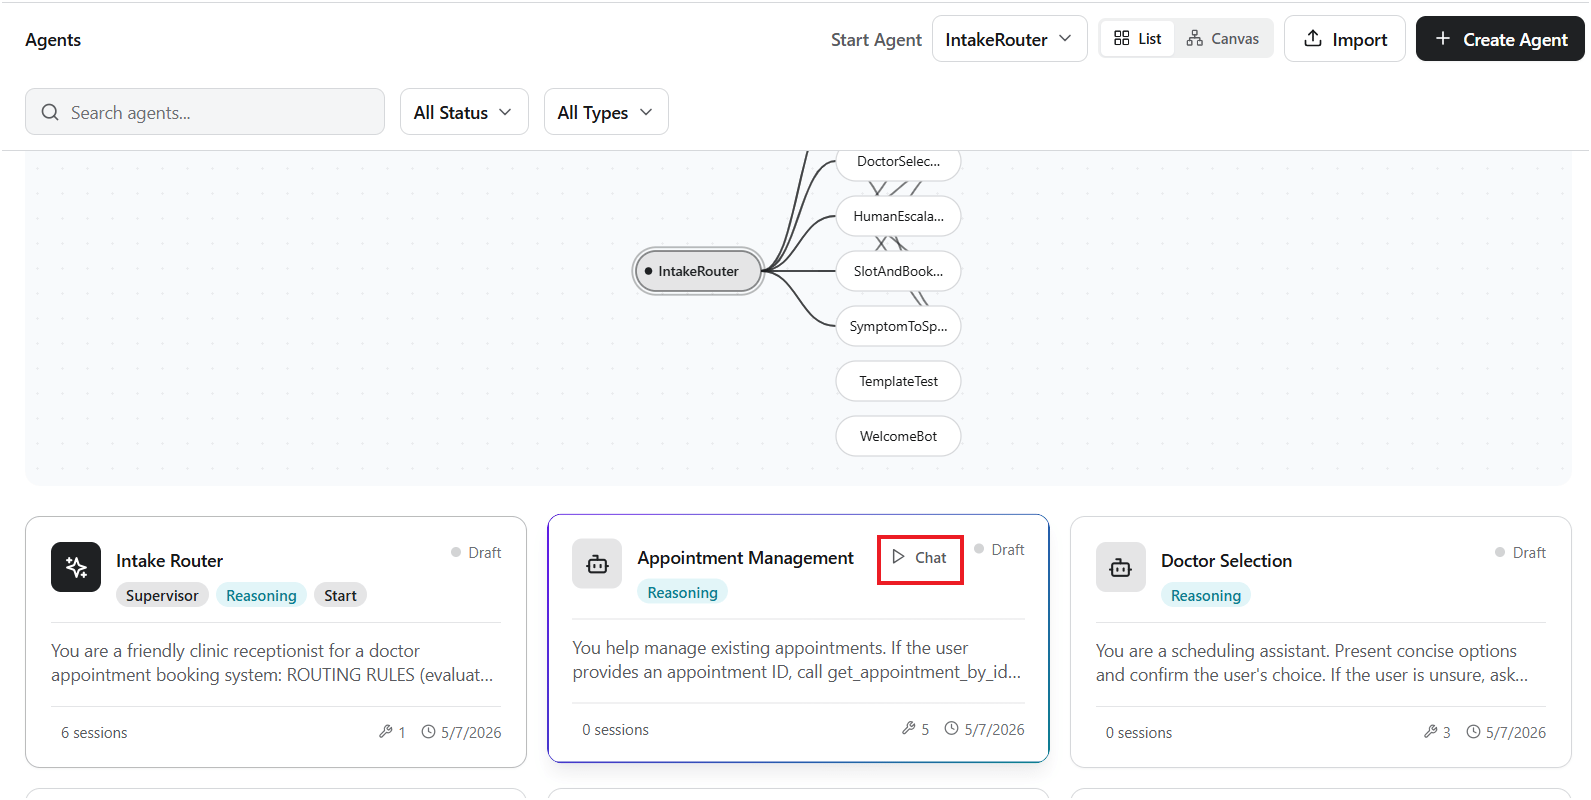 4. Or use the **Chat** option next to any agent on the **Overview** page.
  5. Studio creates a test session.
* **Chat:** Type a message in the chat input and press **Enter**.
* **Voice:** Select the **Voice** tab, choose a configured test target, and click **Start Call**. Speak to the agent using the built-in softphone. A live transcript is displayed during the call.
6. During testing, Studio displays runtime information such as:
* Executed flow steps
* Tool invocations
* Response time
* Live conversation transcript (voice sessions)
## Debug view
The Session Debug view provides real-time visibility into agent execution during a conversation. Use it to inspect responses, trace execution flow, monitor token usage, and diagnose runtime issues.
The left panel displays active and historical chat sessions. The center panel shows the live conversation between the user and the agent, including routed responses and workflow progression. The right-side diagnostics panel provides detailed runtime insights such as trace events, model usage, token consumption, session identifiers, and timeout diagnostics in real-time.
| Signal | What it means | What to do |
| ------------------------------------ | ----------------------------------------------------------- | ----------------------------------------------------------------------------------- |
| High response latency on a turn | A tool call is slow or the LLM loop ran multiple iterations | Check the trace for slow `tool_call` spans; consider adding `ON_ERROR` retry limits |
| Unexpected handoff | Supervisor routed to wrong agent | Review the `handoff_match` trace event and refine `WHEN` conditions |
| Tool called with wrong parameters | `GATHER` field mismatch or type error | Check `gather_extraction` trace events and validate field types in ABL |
| Guardrail triggered unexpectedly | Output hit a content or format boundary | Review `guardrail_eval` trace events and adjust guardrail thresholds |
| Agent asks for data already provided | Session state not passed during handoff | Check `PASS` declarations in `HANDOFF` blocks |
For voice test sessions, the debug view also displays the live call transcript. After the call is complete, you can inspect the session and its execution traces in the same way as chat sessions.
## Using traces to debug
Use traces to inspect every decision, tool call, state update, and handoff during execution.
1. Open your project in Studio.
2. Navigate to Sessions and select a session.
3. Click the Traces tab to view the full execution trace.
4. Use filters to narrow results by event type, agent, or time range.
### Trace structure
Each session produces a hierarchical execution trace organized into spans.
```
Session
+-- Turn 1
| +-- LLM Call
| +-- Tool Call
| | +-- Tool Result
| +-- Response
+-- Turn 2
| +-- Decision
| +-- Handoff
| +-- Response
```
For repeatable, automated testing beyond manual chat, the platform supports Personas, Scenarios, and Evals. [Learn More](/agent-platform/evals).
5. Studio creates a test session.
* **Chat:** Type a message in the chat input and press **Enter**.
* **Voice:** Select the **Voice** tab, choose a configured test target, and click **Start Call**. Speak to the agent using the built-in softphone. A live transcript is displayed during the call.
6. During testing, Studio displays runtime information such as:
* Executed flow steps
* Tool invocations
* Response time
* Live conversation transcript (voice sessions)
## Debug view
The Session Debug view provides real-time visibility into agent execution during a conversation. Use it to inspect responses, trace execution flow, monitor token usage, and diagnose runtime issues.
The left panel displays active and historical chat sessions. The center panel shows the live conversation between the user and the agent, including routed responses and workflow progression. The right-side diagnostics panel provides detailed runtime insights such as trace events, model usage, token consumption, session identifiers, and timeout diagnostics in real-time.
| Signal | What it means | What to do |
| ------------------------------------ | ----------------------------------------------------------- | ----------------------------------------------------------------------------------- |
| High response latency on a turn | A tool call is slow or the LLM loop ran multiple iterations | Check the trace for slow `tool_call` spans; consider adding `ON_ERROR` retry limits |
| Unexpected handoff | Supervisor routed to wrong agent | Review the `handoff_match` trace event and refine `WHEN` conditions |
| Tool called with wrong parameters | `GATHER` field mismatch or type error | Check `gather_extraction` trace events and validate field types in ABL |
| Guardrail triggered unexpectedly | Output hit a content or format boundary | Review `guardrail_eval` trace events and adjust guardrail thresholds |
| Agent asks for data already provided | Session state not passed during handoff | Check `PASS` declarations in `HANDOFF` blocks |
For voice test sessions, the debug view also displays the live call transcript. After the call is complete, you can inspect the session and its execution traces in the same way as chat sessions.
## Using traces to debug
Use traces to inspect every decision, tool call, state update, and handoff during execution.
1. Open your project in Studio.
2. Navigate to Sessions and select a session.
3. Click the Traces tab to view the full execution trace.
4. Use filters to narrow results by event type, agent, or time range.
### Trace structure
Each session produces a hierarchical execution trace organized into spans.
```
Session
+-- Turn 1
| +-- LLM Call
| +-- Tool Call
| | +-- Tool Result
| +-- Response
+-- Turn 2
| +-- Decision
| +-- Handoff
| +-- Response
```
For repeatable, automated testing beyond manual chat, the platform supports Personas, Scenarios, and Evals. [Learn More](/agent-platform/evals).